|
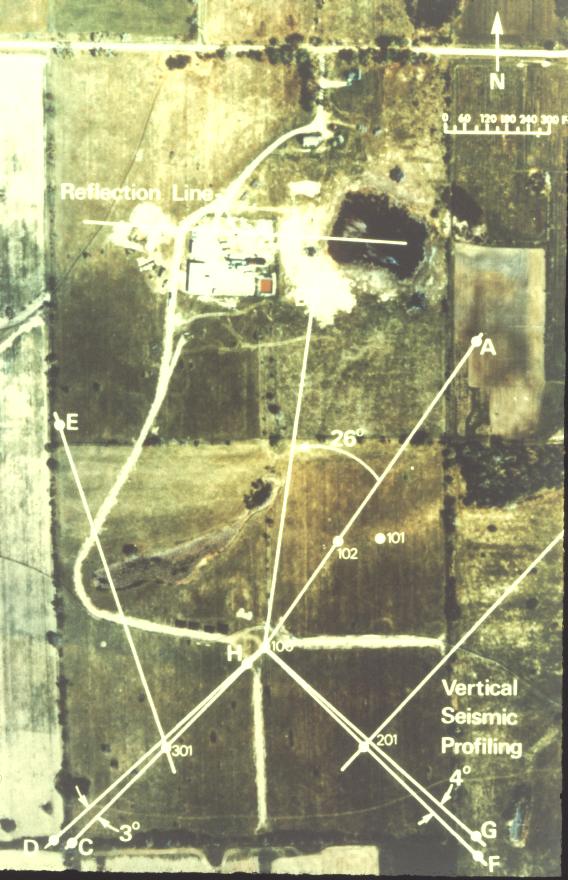
(A) (B) Fig. A The VSPs shot on the project site. The letted sites are the shotpoints. Fig. B Compressional and shear wave velocity structure from well 100. The sonic log is showm for comparison wit the P-wave structure |
|
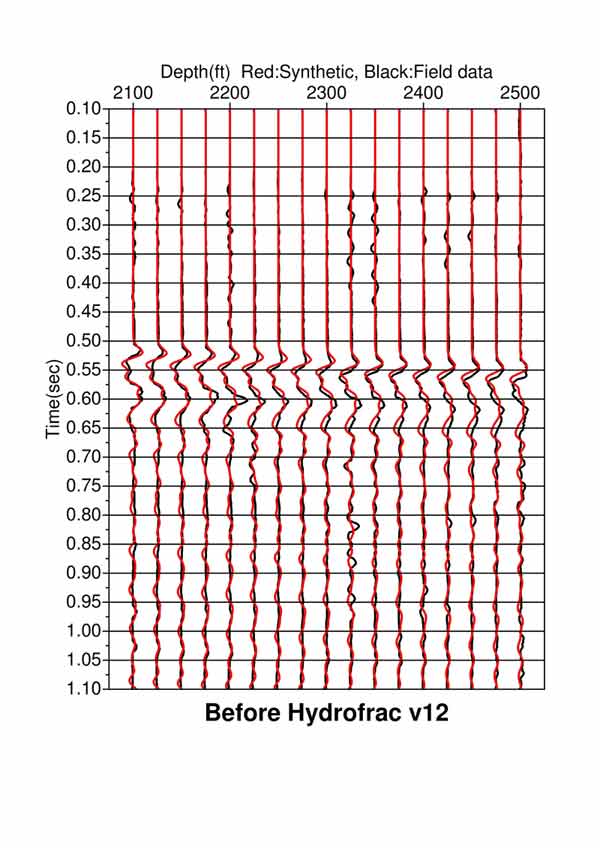
Visco-elastic Synthetic modeling of the Hydrofrac Model
1. Field data |
|
(A) (B) Fig. A The VSPs shot on the project site. The letted sites are the shotpoints. Fig. B Compressional and shear wave velocity structure from well 100. The sonic log is showm for comparison wit the P-wave structure |
|
The before data were collected in August 1978, and the after data were shot in October 1979
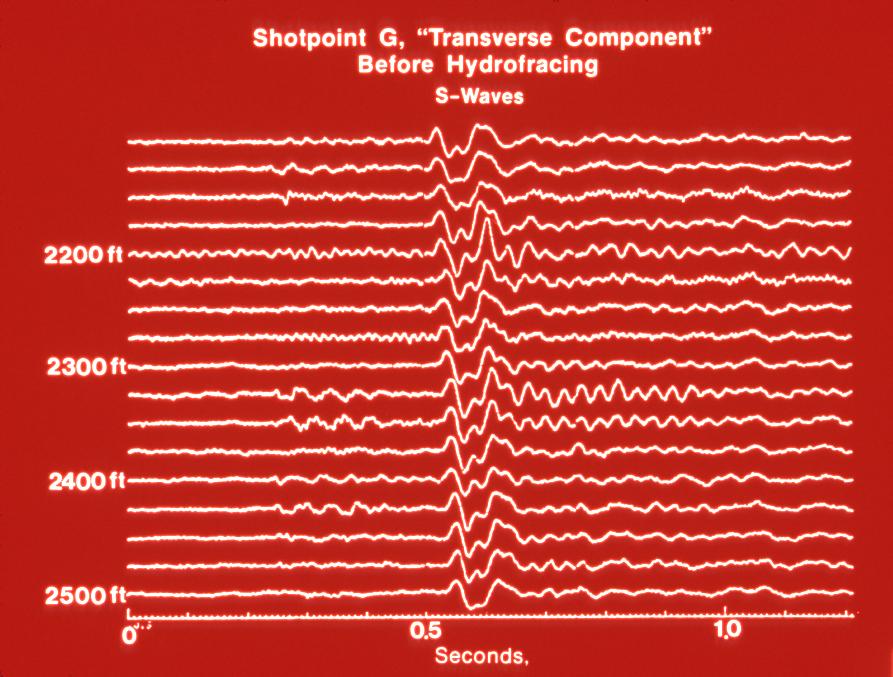
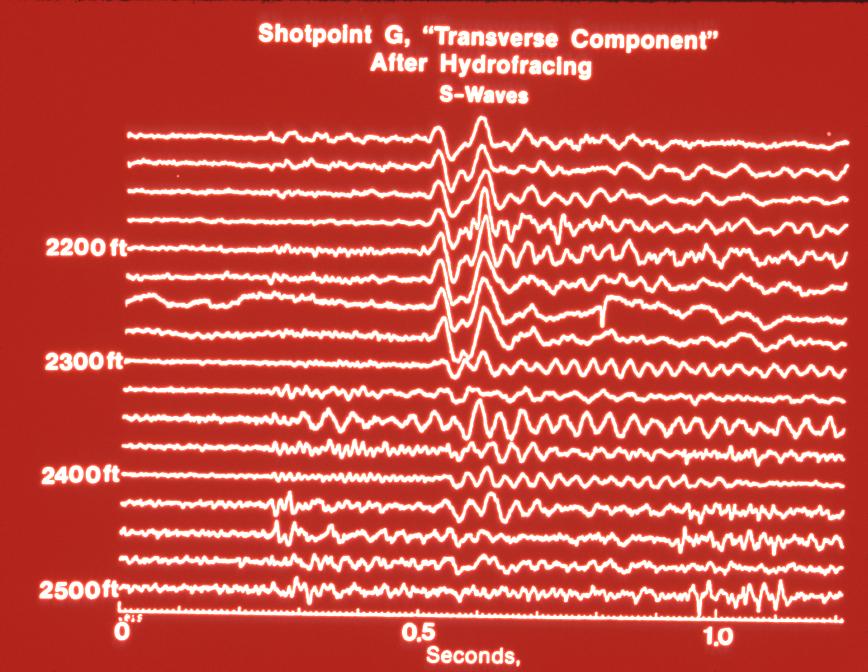
(A) (B) Fig. A SH arrival form shotpoint G. Before Hydrofracing Fig. B An exploded view form figure 9.17 forcusing on the SH-wave shadow seen in well 100 from shotpoint G |
|
2. Convert Hardcopy data to Seg-y 2.1 Segy Before hydrofracing
2.2 Segy After hydrofracing
|
|
|
|
3. Model velocity & Generation 3.1 Model velocity
|
|
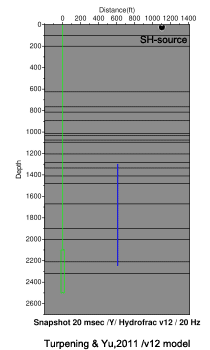
1. Model #10 Note that hydrofrac depth : 1800ft~2300ft
Concept
|
|
4. Synthetic Modeling 4.1 Model 8 - 25 Hz source
4.2 Model 8 -10Hz source
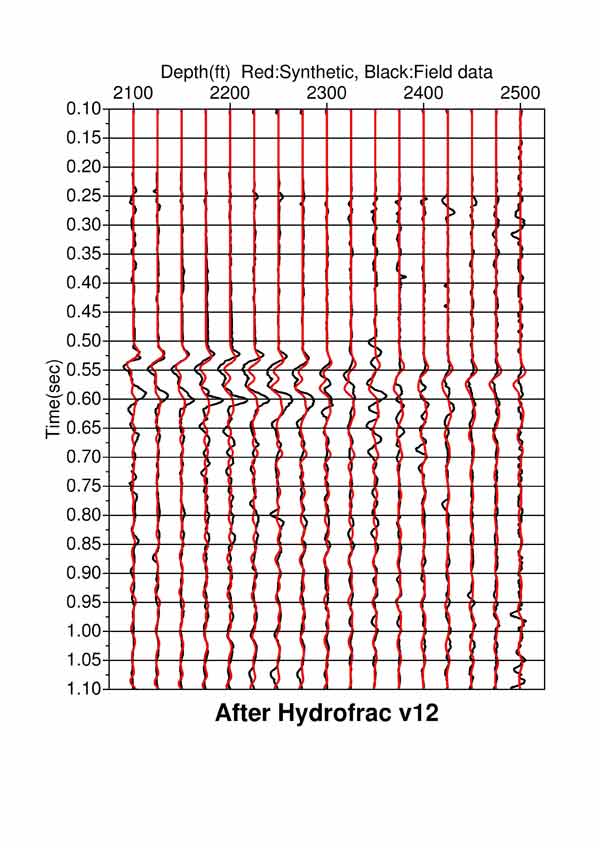
4.1 Model V12 - 20Hz source(10,30Hz convolution)
snapshot file download file : save as animated gif file(718kb)
|
|
|
|
|
|
|
|
|